Data visualization
Going beyond with infomation
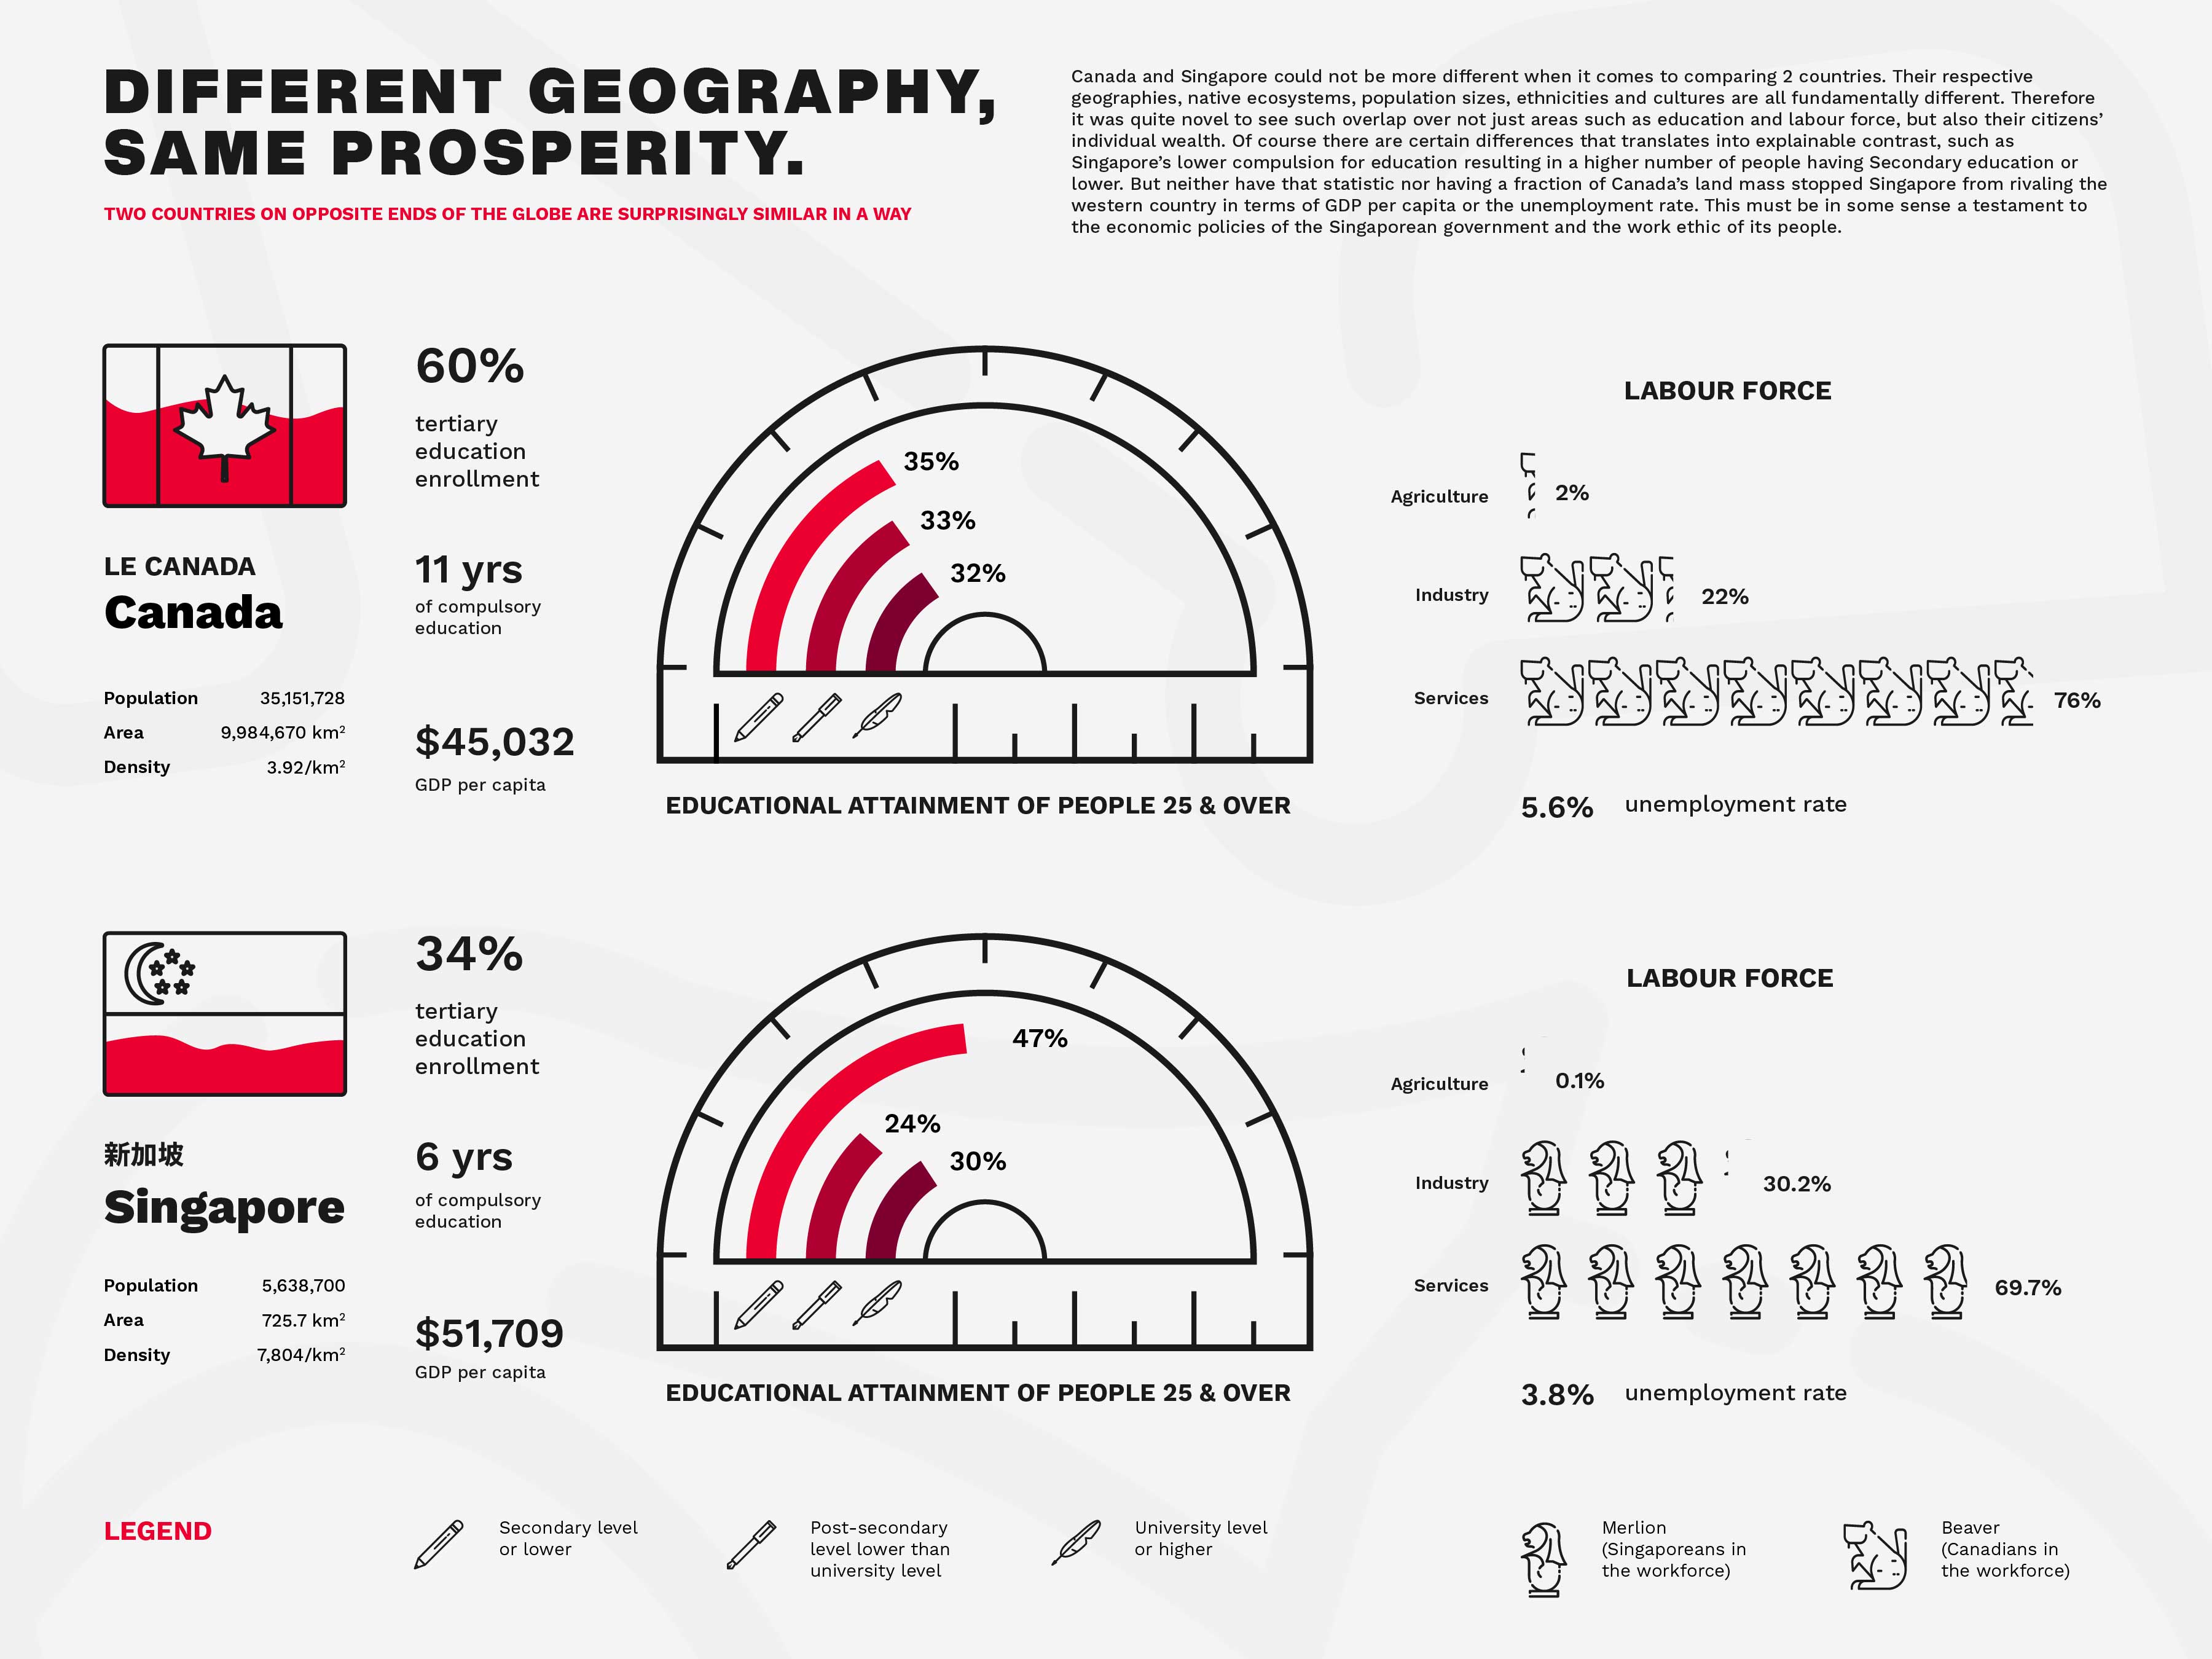
Canada and Singapore could not be more different. That is why it was so interesting to seee so much overlap between how each of them prosper, in areas such as education, labour and overal wealth, despite the stark contrast in enviroments and cultures. One of two areas that I’m focusing on for my visualizations is education, the other being income. I went for the former feeling that my options would be more limited otherwise.
Timeline
February - March 2020
Field
Information design, Data visualization
Technologies
Illustrator
Output